Enter and analyze the following data in SPSS
You will be entering and analyzing the following data in SPSS. When entering the data, please use 1 for Red, 2 for Yellow, and 3 for Green. Make sure that you go to the variable view window and enter these values in the label box.
Twenty senior students were asked to choose the color they preferred for their senior-class shirt. Conduct a chi-square goodness-of-fit test to test the null hypothesis that says there is no true difference in the population from which the sample was drawn.
| Student | Color | Color Code |
| 1 | Red | 1 |
| 2 | Yellow | 2 |
| 3 | Green | 3 |
| 4 | Red | 1 |
| 5 | Red | 1 |
| 6 | Yellow | 2 |
| 7 | Yellow | 2 |
| 8 | Yellow | 2 |
| 9 | Yellow | 2 |
| 10 | Red | 1 |
| 11 | Yellow | 2 |
| 12 | Green | 3 |
| 13 | Red | 1 |
| 14 | Yellow | 2 |
| 15 | Yellow | 2 |
| 16 | Yellow | 2 |
| 17 | Yellow | 2 |
| 18 | Yellow | 2 |
| 19 | Yellow | 2 |
| 20 | Green | 3 |
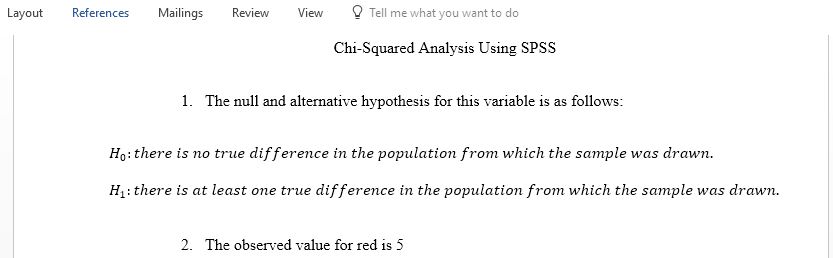
- Please provide the null and alternative hypothesis for this variable.
- Please provide the observed value n for Red.
- Please provide the observed value n for Yellow.
- Please provide the observed value n Green.
- Please provide the expected value for each of the colors.
- Please provide the value of the chi-square test.
- Please provide the value of the associated probability (sig.). Are the results significant at the .05 level?
- Write a statement of the results of the significance test in APA style (make sure to include your decision based on the statistical hypothesis).
Answer preview for Enter and analyze the following data in SPSS
Access the full answer containing 170 words by clicking the below purchase button.