Introduction and procedures for Cooling tower experiment
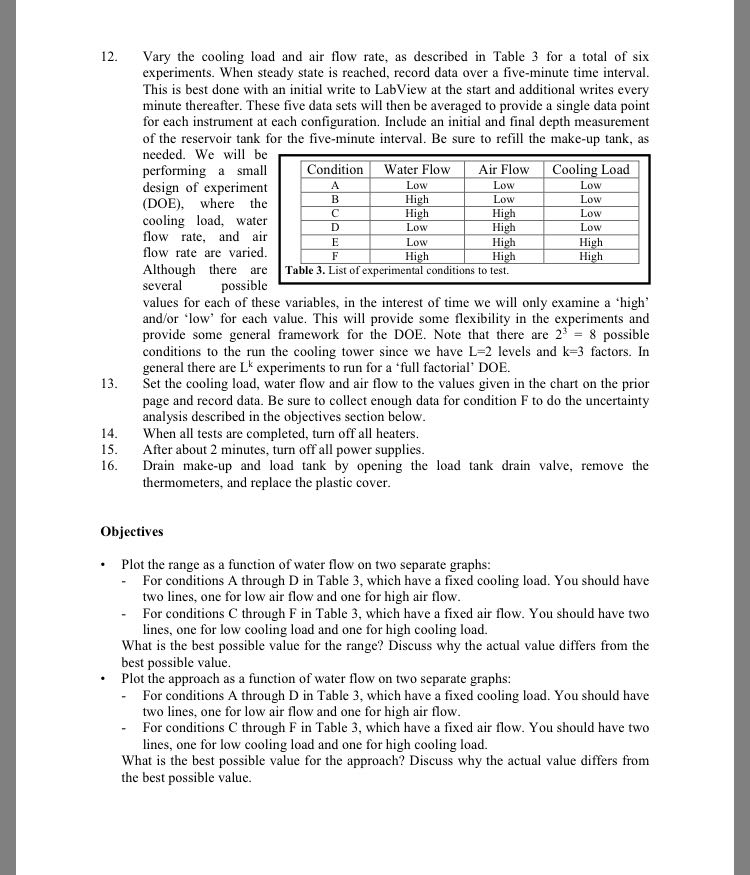
Introduction and procedures for Cooling tower experiment. Plot the range as a function of water flow on two separate graphs.
- for condition A through D in the table 3, which has a fixed cooling load. you should have two lines, one for low air flow and one for high air flow.
Answer preview for Introduction and procedures for Cooling tower experiment
Access the full answer containing 295 words by clicking the below purchase button.