Find the 25th, 50th, 75th percentiles for the data.
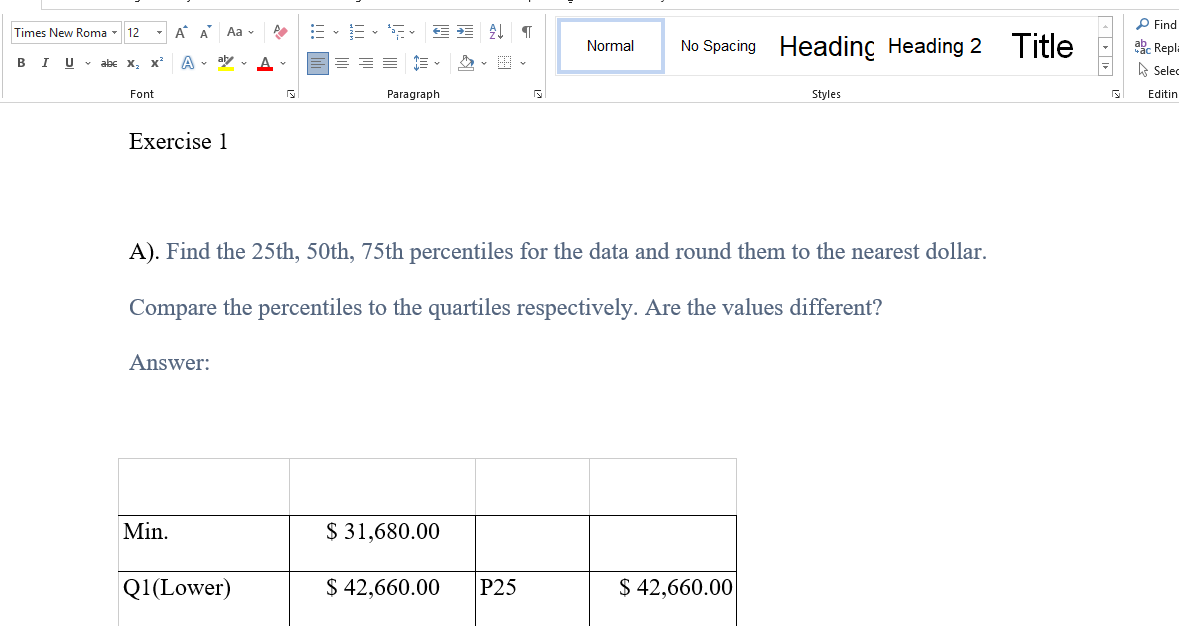
A).Find the 25th, 50th, 75th percentiles for the data and round them to the nearest dollar. Compare the percentiles to the quartiles respectively. Are the values different?
B). Construct a box-and-whisker plot for the data. Describe the shape of the distribution.
C). Select two majors (for example marketing and management). Find the mean, standard deviation, and five-number summary for the starting salaries by each major you selected. Round the results to the nearest dollar. Interpret your results in the context of the problem.
D). Construct a side-by-side (comparative) box-and-whisker plot for the annual starting salaries by each major you selected in Part E. Describe each distribution. Format the vertical axes and your graph appropriately.
Exercise 2
A). Construct a comparative ( also known as Side-by-side) box-and-whisker plot and find the summary statistics including the quartiles for the net sales. (APA)
Answer preview for calculate the 25th, 50th, 75th percentiles for the data.
Access the full answer containing 711 words by clicking the below purchase button