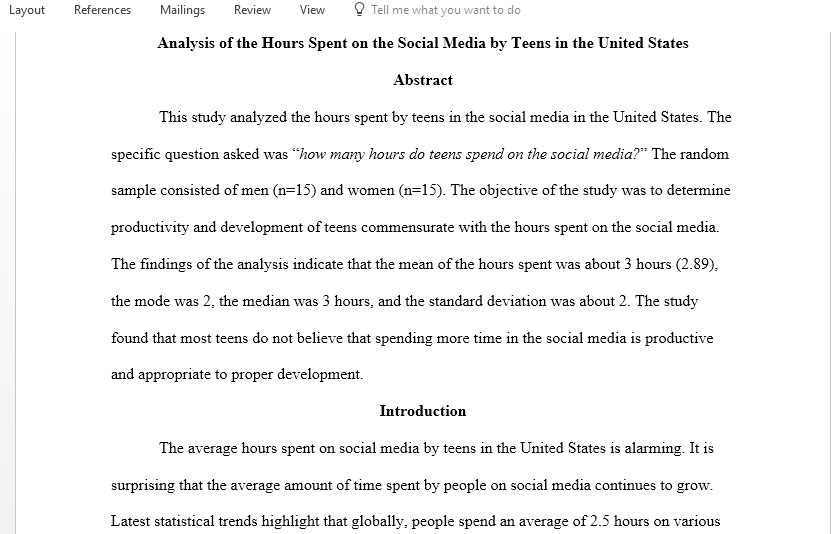
Analysis of the Hours Spent on the Social Media by Teens in the United States
Topic: Analysis of the Hours Spent on the Social Media by Teens in the United States.
STEP 1: You are doing research on a topic of interest. Decide what you want to research. To complete this research you will need to determine a question that has a numerical response. Identify a random sample of n = 15 men and n = 15 women. NOTE: Though it is suggested, you do not have to separate your data by gender. You may choose another delineation such as (parents/non-parents; adults over age 30/ adults under age 30; athletes/ non-athletes; etc….). Be sure to identify this in your initial abstract. You must answer this question: How do you establish that this sample is truly random?
STEP 2: Have each subject answer the question and give a numerical response.
STEP 3: You will analyze your data and compute the following statistics for each group:
1) The Mean and standard deviation of the numbers
2) The Median for the data
3) The Mode for the data
4) The 90% confidence interval of the mean
STEP 4: Construct a complete hypothesis test and determine if the two groups have significantly different responses using α = 0.05.
STEP 5: Write a one page introduction to your research, discuss how you selected your sample (is it a random sample?) and write a one page conclusion. Present your data in an organized manner. Submit a full written report.
Written Report:
This MUST include:
o Title Page
o Abstract: First paragraph that briefly summarizes the paper, the motivation for choosing your topic, and include a general comment about the conclusion. (Usually this is written last.)
o List of data results
o Statistical Measurements (From Step 3)
o Description of what is happening in your data by making statistical measurements. Do not talk about what the data implies here. Just describe what is happening. You will talk about what it implies in the conclusion section.
The description of the data MAY include:
- General Trends or patterns
- Differences in measurements depending on stratification of data or over time.
- Variation
- Margin of Error and Confidence Interval
- Experimental Probability and Probability Distribution Tables
- Linear or Exponential model
o Complete hypothesis test to determine if the two groups have significantly different responses using α = 0.05.
o Labeled charts or graphs. Insert them where you discuss your findings and refer to the charts or graphs.
o Conclusion. This MAY include:
- Did the study achieve its goals?
- Do the conclusions make sense? Can you rule out alternative explanations for the results? If the conclusions do make sense, do they have any practical significance?
- Discussion on how the description of your data addresses your question.
- What the description of the data implies about the whole population.
- Discussion of what confounding variables you would address if you did it again and what confounding variables are very difficult to address
- Extrapolation by predicting what will happen in the future using your regression equation.
o Include the survey (if you did one) with a link in the Appendix.
o Include the data as a table in the Appendix
Answer preview for Analysis of the Hours Spent on the Social Media by Teens in the United States

Access the full answer containing 1650 words by clicking the below purchase button.
